
The Subtle Shift

Approaching the end of the 6th Community Pharmacy Agreement and commencement of 7th CPA it is both timely and instructional to reflect on whether it was better, worse or close to original expectations.
One clear benefit of the 6th CPA was the reinstatement of indexation on dispense fees over the period of the Agreement. Offsetting this however was that if prescription volume varied against expectation, there was no compensation (known as “risk share”) available. The expected prescription volume was agreed and published in the Schedule to the Agreement.
During the first two years of the 6CPA, prescription volume was below expectation (in fact according to the Pitcher Partners client base data, down 0.5% in 2016 and 2.2% in 2017 excluding warehouse and hospital pharmacies). Various factors influenced this not least of which was the rescheduling of some items during the initial years of the Agreement. Fortunately, the Pharmacy Guild was able to successfully negotiate with Government and obtain a ‘risk-share’ arrangement commencing 1 July 2017 of $0.32 (indexed) per prescription.
Table 1 outlines the growth in the general dispense fees (ex-safety-net recording and other specific fees) over the life of the Agreement. Remuneration per subsidised prescription increased by 13.5% from $10.41 to $11.82 from FY16 to FY20.
Table 1
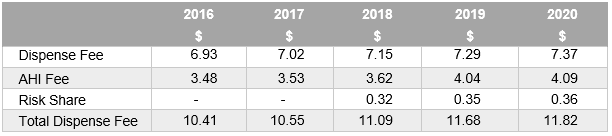
(Note: The risk-share arrangement has been extended for 3 year into the 7th Agreement but it remains vulnerable over the medium term)
Counteracting the increase in PBS prescription remuneration was both the reduction in PBS prescriptions and more broadly, the effect of low inflation over the five year period, most notably in the latter stages during 2019 and 2020. Specifically, the general dispense fee of $7.29, only increased by 1.1% to $7.37 providing a clear reflection of a low growth Australian economy. This lack of growth (and by default confidence) is influencing consumer behaviour particularly for individuals receiving Government pensions, self-funded retirees relying on historically low interest returns and working Australians receiving minimal pay increases. Each of these drivers trigger how customers behave and ultimately defines where a prescription presents itself with the various categories of the PBS.
Included in the forward estimates of prescription volume growth, there were approximation forecasts of the expected volume of under co-payment prescriptions. Over the life of the Agreement it was estimated that the growth in this category would be circa 35%. By the end of the Agreement it was also anticipated that 29% of total scripts dispensed would be below the co-payment threshold and therefore not PBS funded (refer Graph 1). The major driving influences of this category’s rise in prominence was the ongoing reduction in price of many molecules coupled with an increasing co-payment.
Graph 1
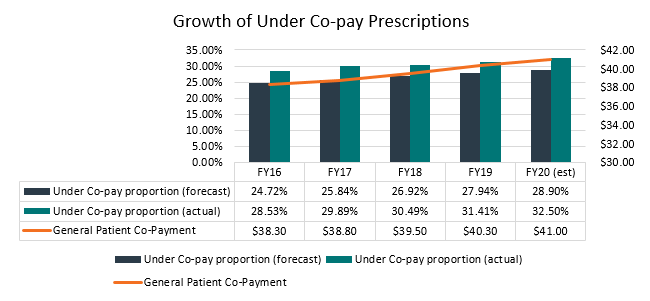
(Note: this PBS data all community pharmacies (incl warehouse) and hospital pharmacies)
The reality is that the volume of prescriptions under the co-payment contribution has increased at a faster rate than was expected within the Agreement. For the year ended 30 June 2019 the forecast was that 27.94% of total scripts would fall into this category however this group now represents 31.41% according to the PBS published data. Considering the data’s present trajectory we expect “Under co-pays” to approximate 32.5% by the end of the 6th Agreement (which is well above the original estimate as outlined Graph 1.
So What Does This Mean for a Community Pharmacy, its Customers and 7CPA?
If we isolate community pharmacy alone (ex warehouse pharmacies), PP client base averages for the 2019 financial year suggest on average 35.8% of total prescriptions are subject to price competition (below co-payment).
Over time, the volume of prescriptions subject to price competition will inevitably continue to increase. Given the current trajectory, our estimate is that by the end of the 7th Agreement there could be circa 50% of total script volume potentially subject to price competition. Therefore, vigilance is required in order to manage margin and meet/exceed customer expectations. (For more on this topic please refer to my previous article which explores the issue of falling customer numbers and the balance needed between growing margin dollars through margin maintenance and customer growth = profitable growth.)
Based on the Pitcher Pharmacy Client Base averages, GP$ per prescription over the first four years of the 6CPA is as follows:
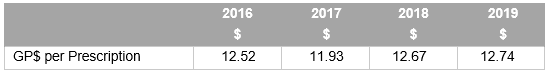
The dip in 2017 was generated by a competitive reaction to Warehouse from Pharmacy owners who aggressively employed both the $1 discount and general discounting in the below co-payment prescription volumes. The 2018 and 2019 results reflect a more tempered approach to balance both a competitive position and profit imperative.
We note that at the time of publishing, the position of the $1 discount is a live but confidential discussion occurring within 7CPA negotiations. The options range from status quo, including it on 100% of prescription volume where there is a co-payment or removing it altogether. The final result may materially affect future financial performance of Pharmacy businesses.
A notable observation from the GP$ per Rx table is that GP$ per prescription plateaued as the volume of prescriptions subject to price competition increased (i.e. the peak in FY19 of 31.41% in Graph 1). In other words, the competitive landscape of pharmacy (as opposed to Government policy) is becoming influential in determining dispensary margins.
Dispensary Pricing - Strategy or Tactic?
The difference between the two is significant.
If price defines strategy (eg Chemist Warehouse), then it must form part of the business DNA and be evident within the range, marketing, fitout, location and the cost of doing business (rent, wages, supply chain logistics etc).
Price when used tactically can be managed both up and down. This is often demonstrated through a discounting decision made at the register or point of dispensing (i.e. how the prescription is treated and priced). It is usually derived from an assessment a customer’s value to the pharmacy. An example would be to price match one script in order to maintain the other 2 or 3 scripts plus retail items the customer may buy each visit.
Stratifying the data from the FY19 Pitcher Pharmacy Client Base averages reveals the spread of prescription volume growth, volume subject to price competition and GP$ per script achieved across different types of pharmacies (refer Table 2 below).
Table 2
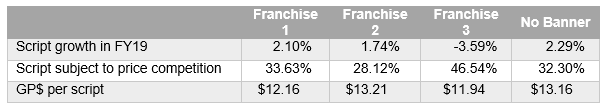
The group with the lowest GP$ per prescription simply have not grown volume enough to justify the lower price. They are 6% below the total average of $12.74 which may not seem significant. However, to preserve profitability, volume needed to grow by 25%. It did not, meaning the net profit impact was profound and unsustainable when coupled with rising costs of doing business.
The challenge of dispensary pricing will continue to intensify into 7CPA. Understanding that customers do not buy value but experience value is the foundation to developing a profitable strategy. Managing a customer’s journey is synergistic with optimizing price and value, but generally requires change in many facets of a business that has ceased growing. At Pitcher Pharmacy we can help you use data to gain knowledge and develop insight to drive strategy and performance.


Related Content
FEATURED
Will AI change the way customers choose their pharmacy?

Artificial intelligence is no longer just a technology issue. For community pharmacy owners, it is becoming a retail issue, a service issue and a business model issue. A recent article about Coles...
Read MoreBusiness Risks Survey
Pharmacy – Current Owner
How well are you managing your risks as a pharmacy owner? Get your Business Risks Scorecard to see where you need to take action.
Business Risks Survey
Pharmacy – Future Owner
Thinking about buying an interest in a pharmacy? Take our Survey to see if you know the risks.
Survey
Exploring the pharmacy practice impacts of the 2018 re-scheduling of codeine containing combination analgesics in Australia (A pilot study). Please click the button below to participate.
Pharmacy Impact Survey